


How to Read the Information on the Dacast Video Analytics Dashboard

In this tutorial, we will cover how to read graphs on the Dacast analytics dashboard. For an overall tutorial of our new analytics platform, please read our dedicated tutorial.
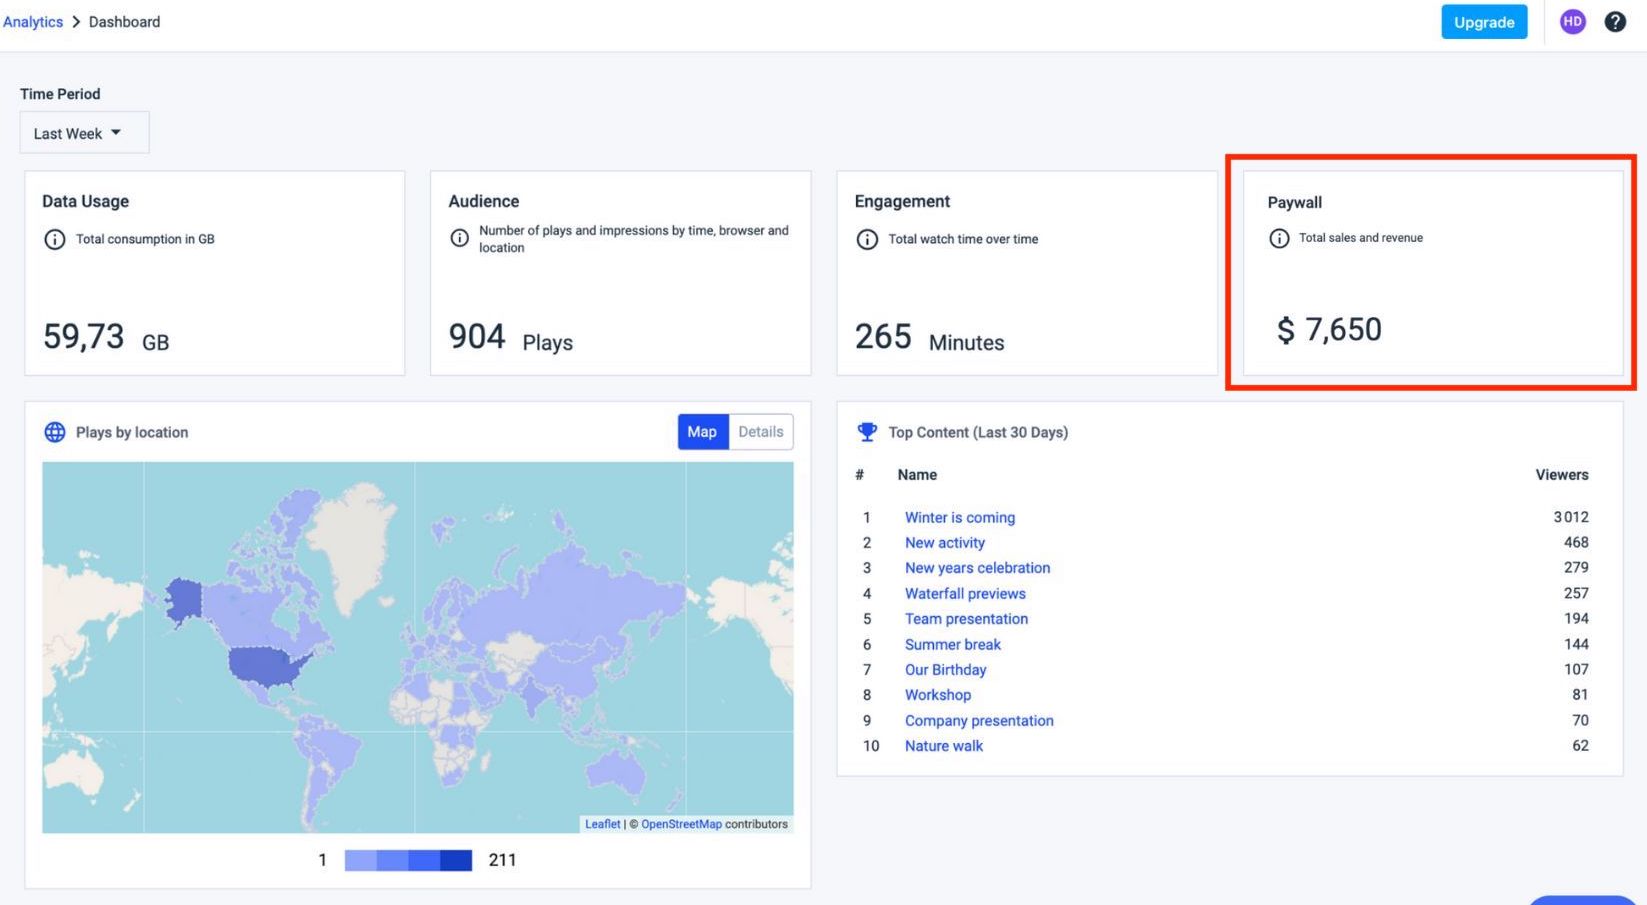
The dashboard gives you an analysis of your overall content and provides you the following general information: data usage, audience, engagement, paywall, plays by location, and top 10 content.

How to Read the Information
To read the information on the Dacast video analytics, you can start by selecting a time period:

Once you’ve clicked on the time frame your data will appear for that selected time.
Then, you can also filter or retrieve analytics data for live stream and video content by selecting the ones you need. Simply click on the “Content Type Filter” button and select the content for which you want to display analytics.

This feature can only be done with the following tabs in the global Analytics section:
- Dashboard
- Data Usage
- Storage Usage
- Audience
- Engagement
Metrics
One of the most important things to know about reading the Dacast analytics is what the graphs are measuring.
Here’s what you need to know about the metrics:
- Data usage: the amount of data used (GBs).
- Audience: number of times your audience played your videos.
- Engagement: number of hours your audience spent viewing your content.
- Paywall: your earnings.
- Plays by Location: countries where your viewers have been playing your content.
- Top Content: your content that works best based on the number of viewers and revenue.
– All stats per hour can be reviewed only for the last 24h
– All stats per day can be reviewed only for the last 30 days
– In all stats for more than 30 days back in time the data consumption is accumulated for the entire month
Data Usage
In your analytics dashboard, you will see your GBs consumption during the selected period.

By clicking on “Data Usage”, you will see the detail of your data usage by time as shown below

Audience
On the right side of the data usage card, you will see “Audience”. In the general dashboard, you will only see the overall number of times your audience played your videos for the period you selected.

By clicking on “Audience”, you will be able to see the Plays (number of times viewers clicked “play” on your video), Impressions (number of times your video player has been displayed to your viewers) and Unique viewers (number of individuals who watch your videos, no matter how many times) by time, device, and location as shown below:
Plays/Impressions/Unique Viewers By Time:

Plays/Impressions/Unique Viewers By Device/Browser:

Plays/Impressions/Unique Viewers By Location:

Engagement
By clicking on the options in the upper right corner, you will be able to see the engagement details by time, device/browser, and location as shown in the following sections below.

By clicking on the options in the upper right corner, you will be able to see the engagement details by time, device/browser, and location as shown in the following sections below.
Engagement/Unique Viewers By Time:

Engagement/Unique Viewers By Device/Browse

Engagement/Unique Viewers By Location:

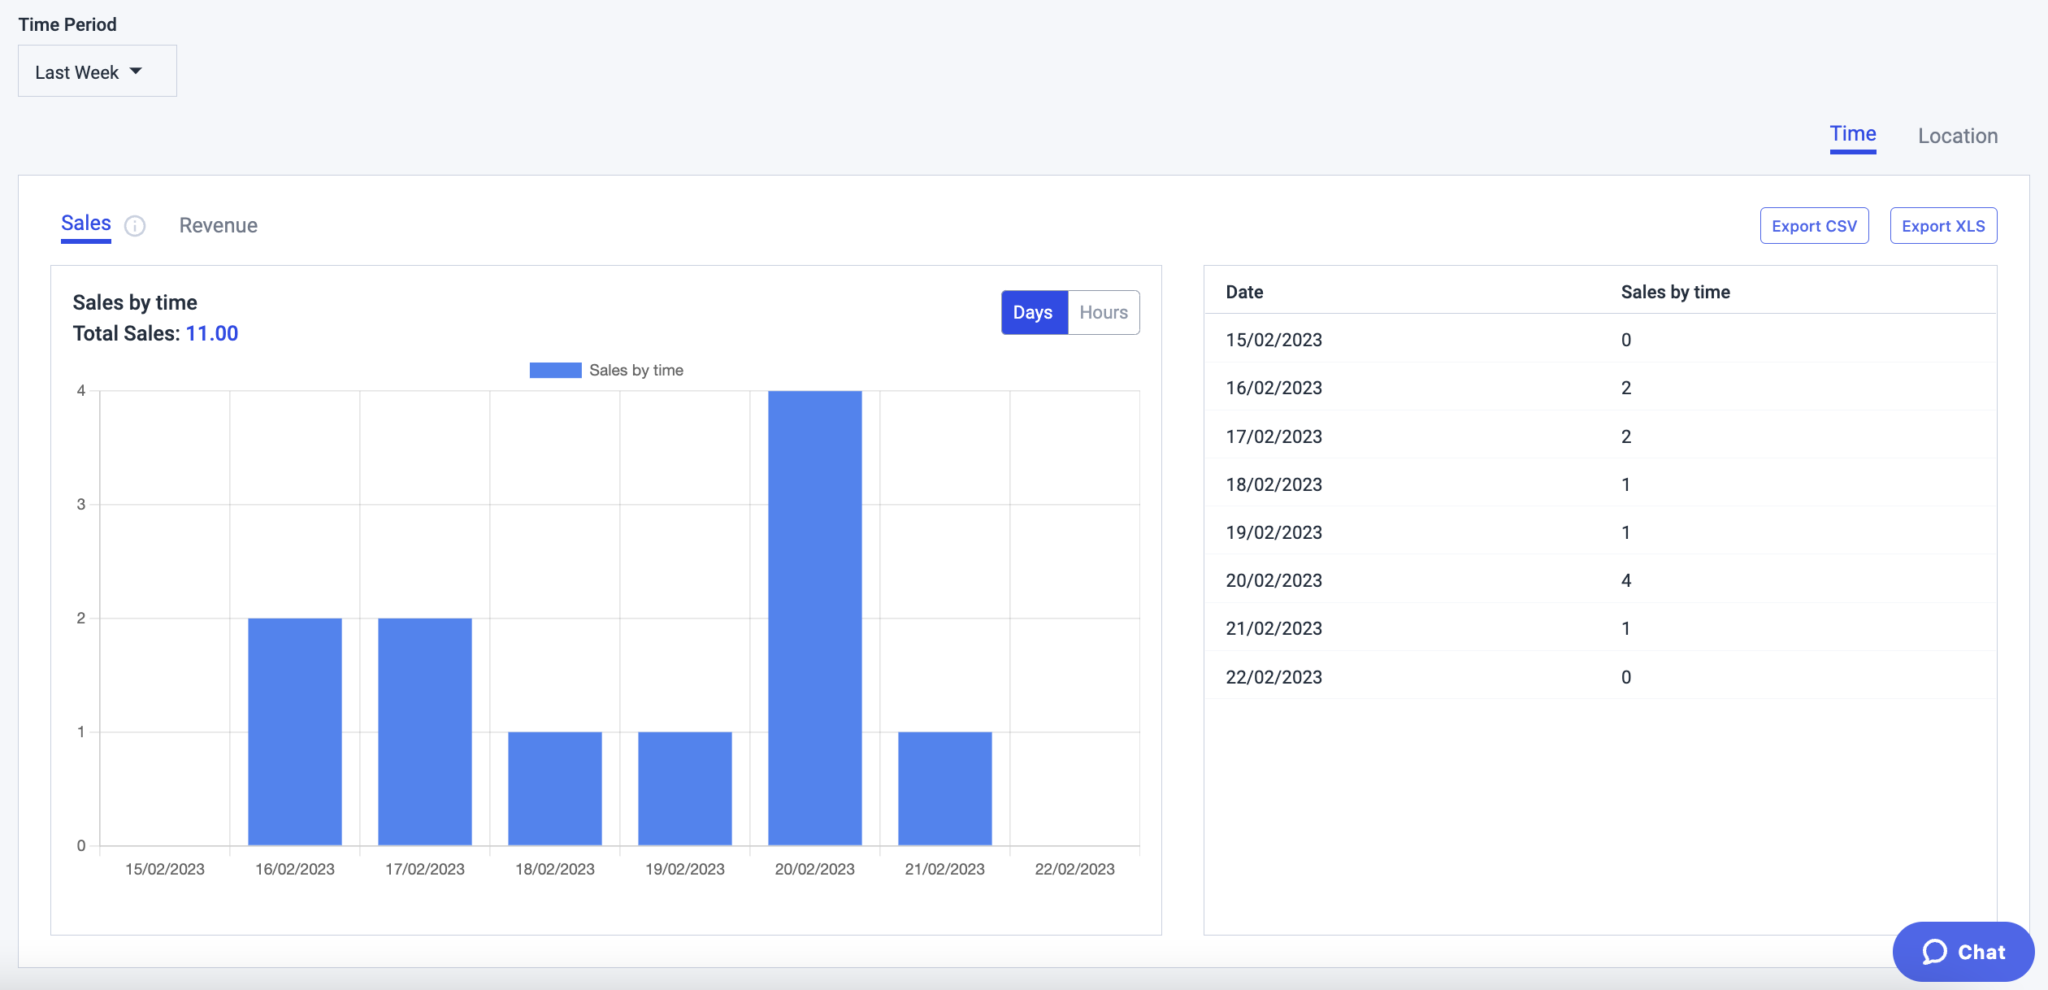
Paywall
To the right of the Engagement card, you will see “Paywall”. In the general dashboard, you will only see the overall earnings, for the time range you’ve selected.
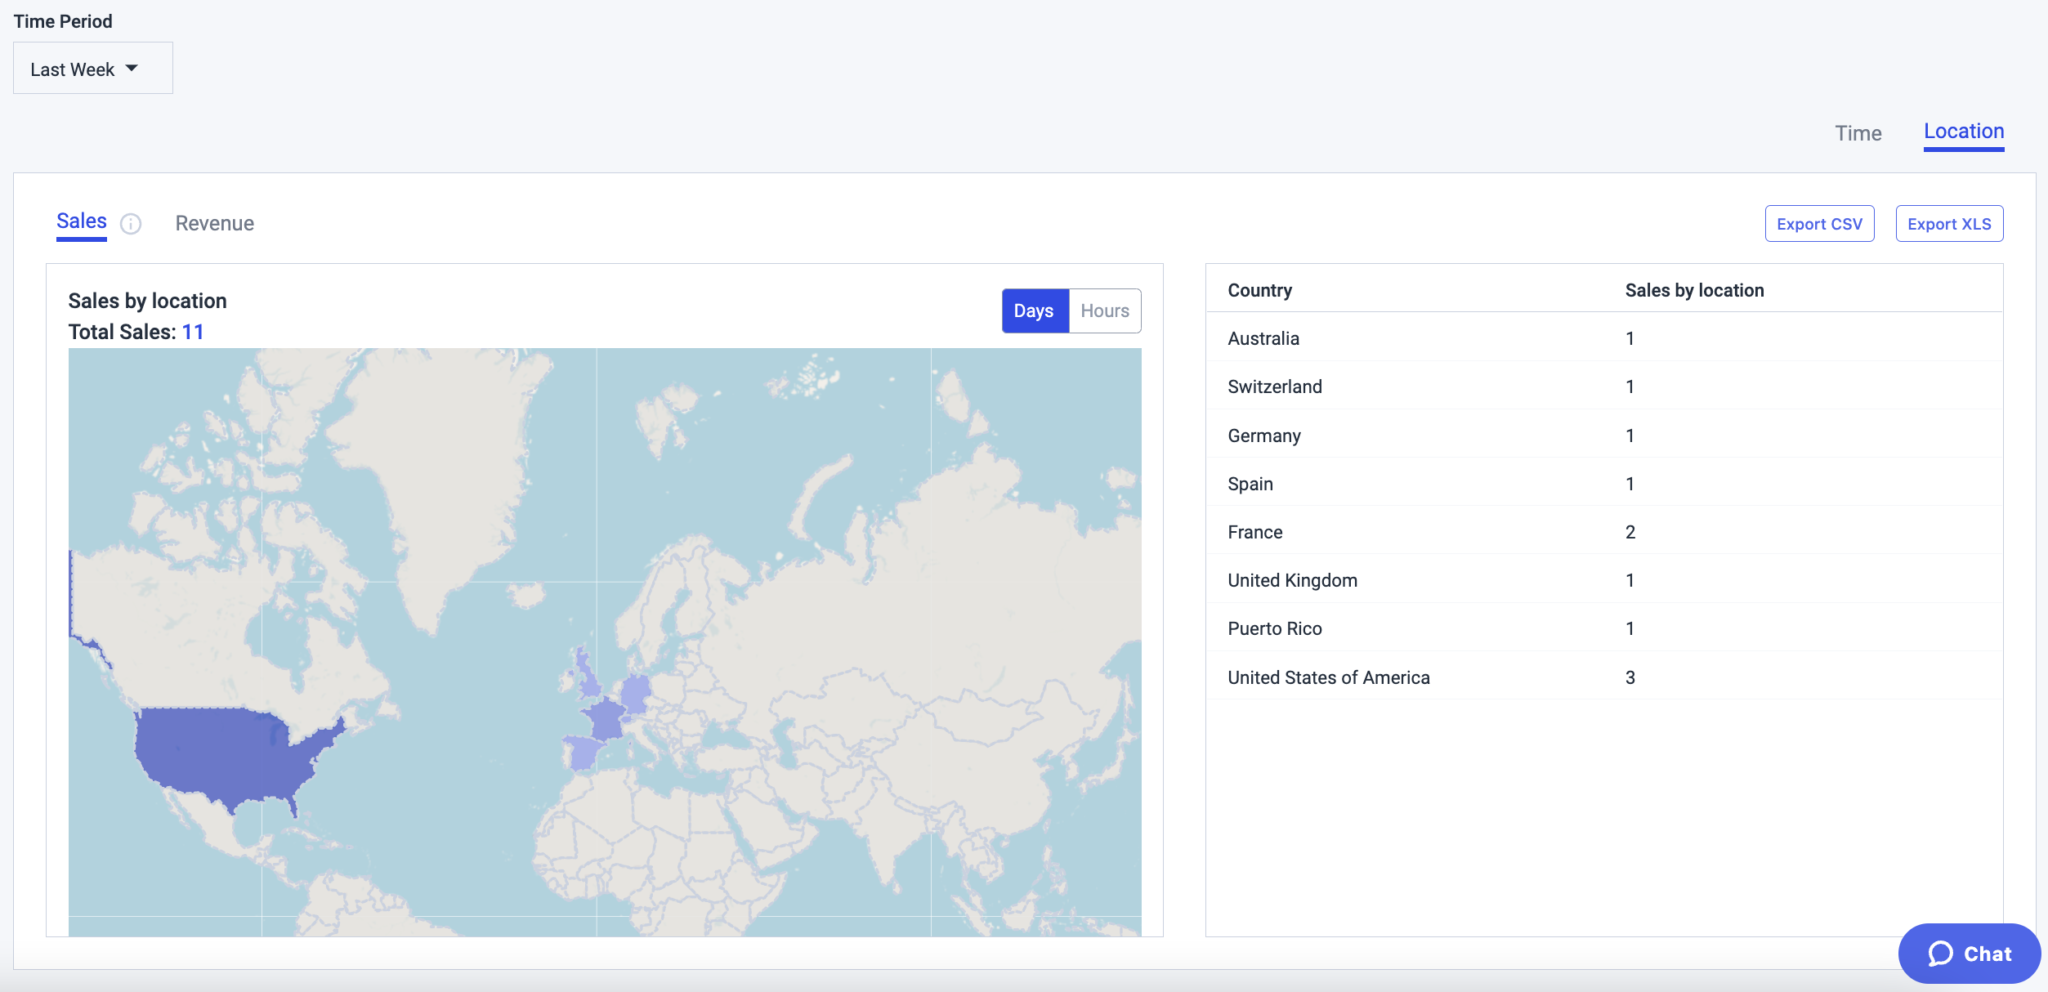
By clicking on “Paywall”, you will be able to see the number of sales and your revenues by time and location as shown below.
By time:
By Location:
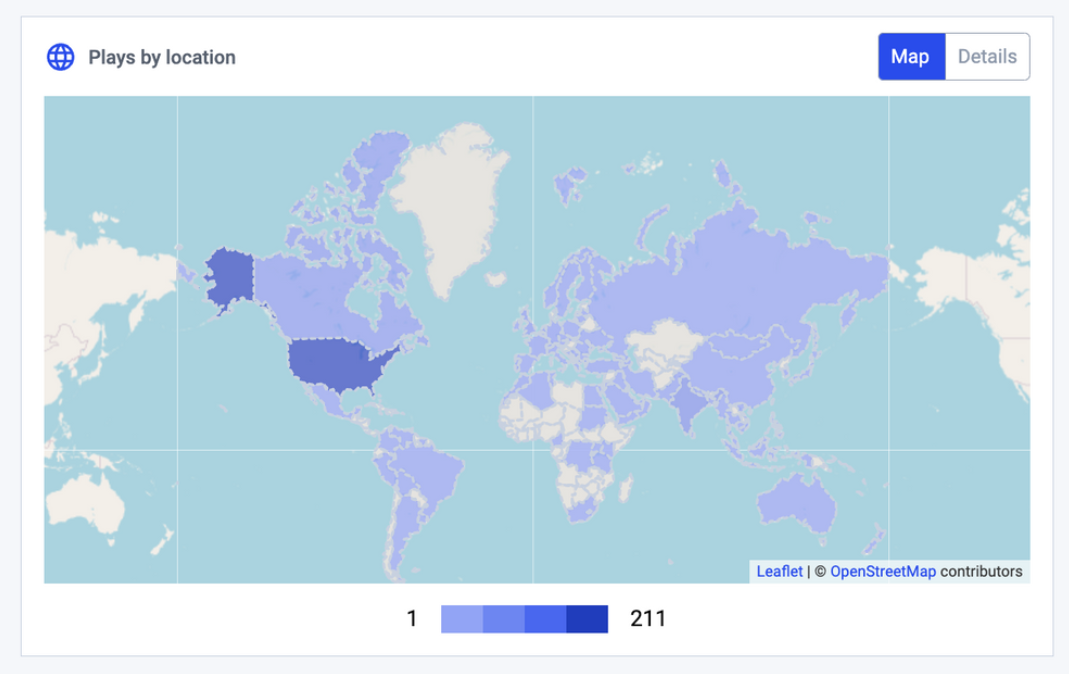
Plays by Location
In the lower-left part, you will see the plays by location. In this map, you will be able to see the number of plays by country, regions and cities for the time range you have selected.
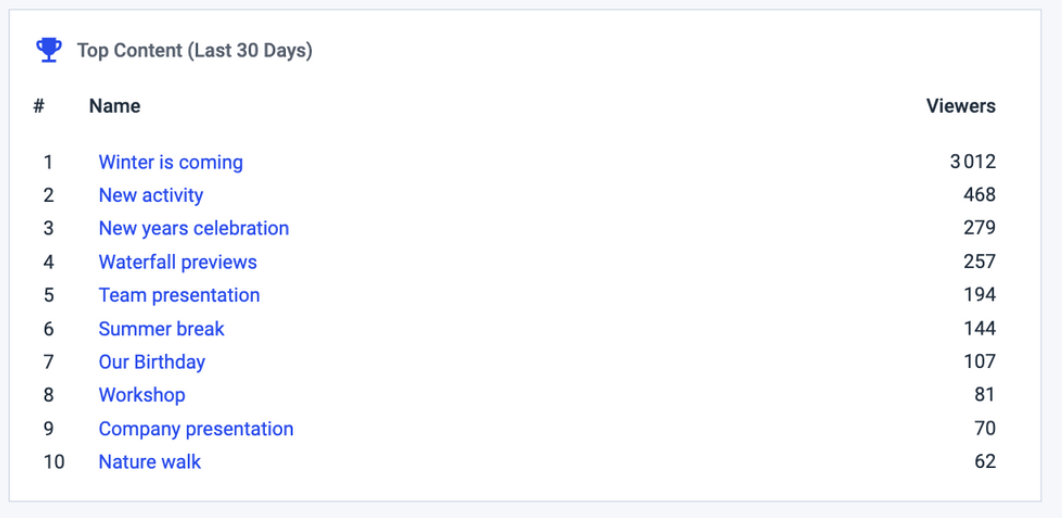
Top 10 Content
Finally, you will see your top 10 content. By clicking on your top 10 content titles, you will see your analytics details for each video content (audience, paywall, engagement; and real time video analytics for live only). Note that any deleted content won’t appear in the top content.
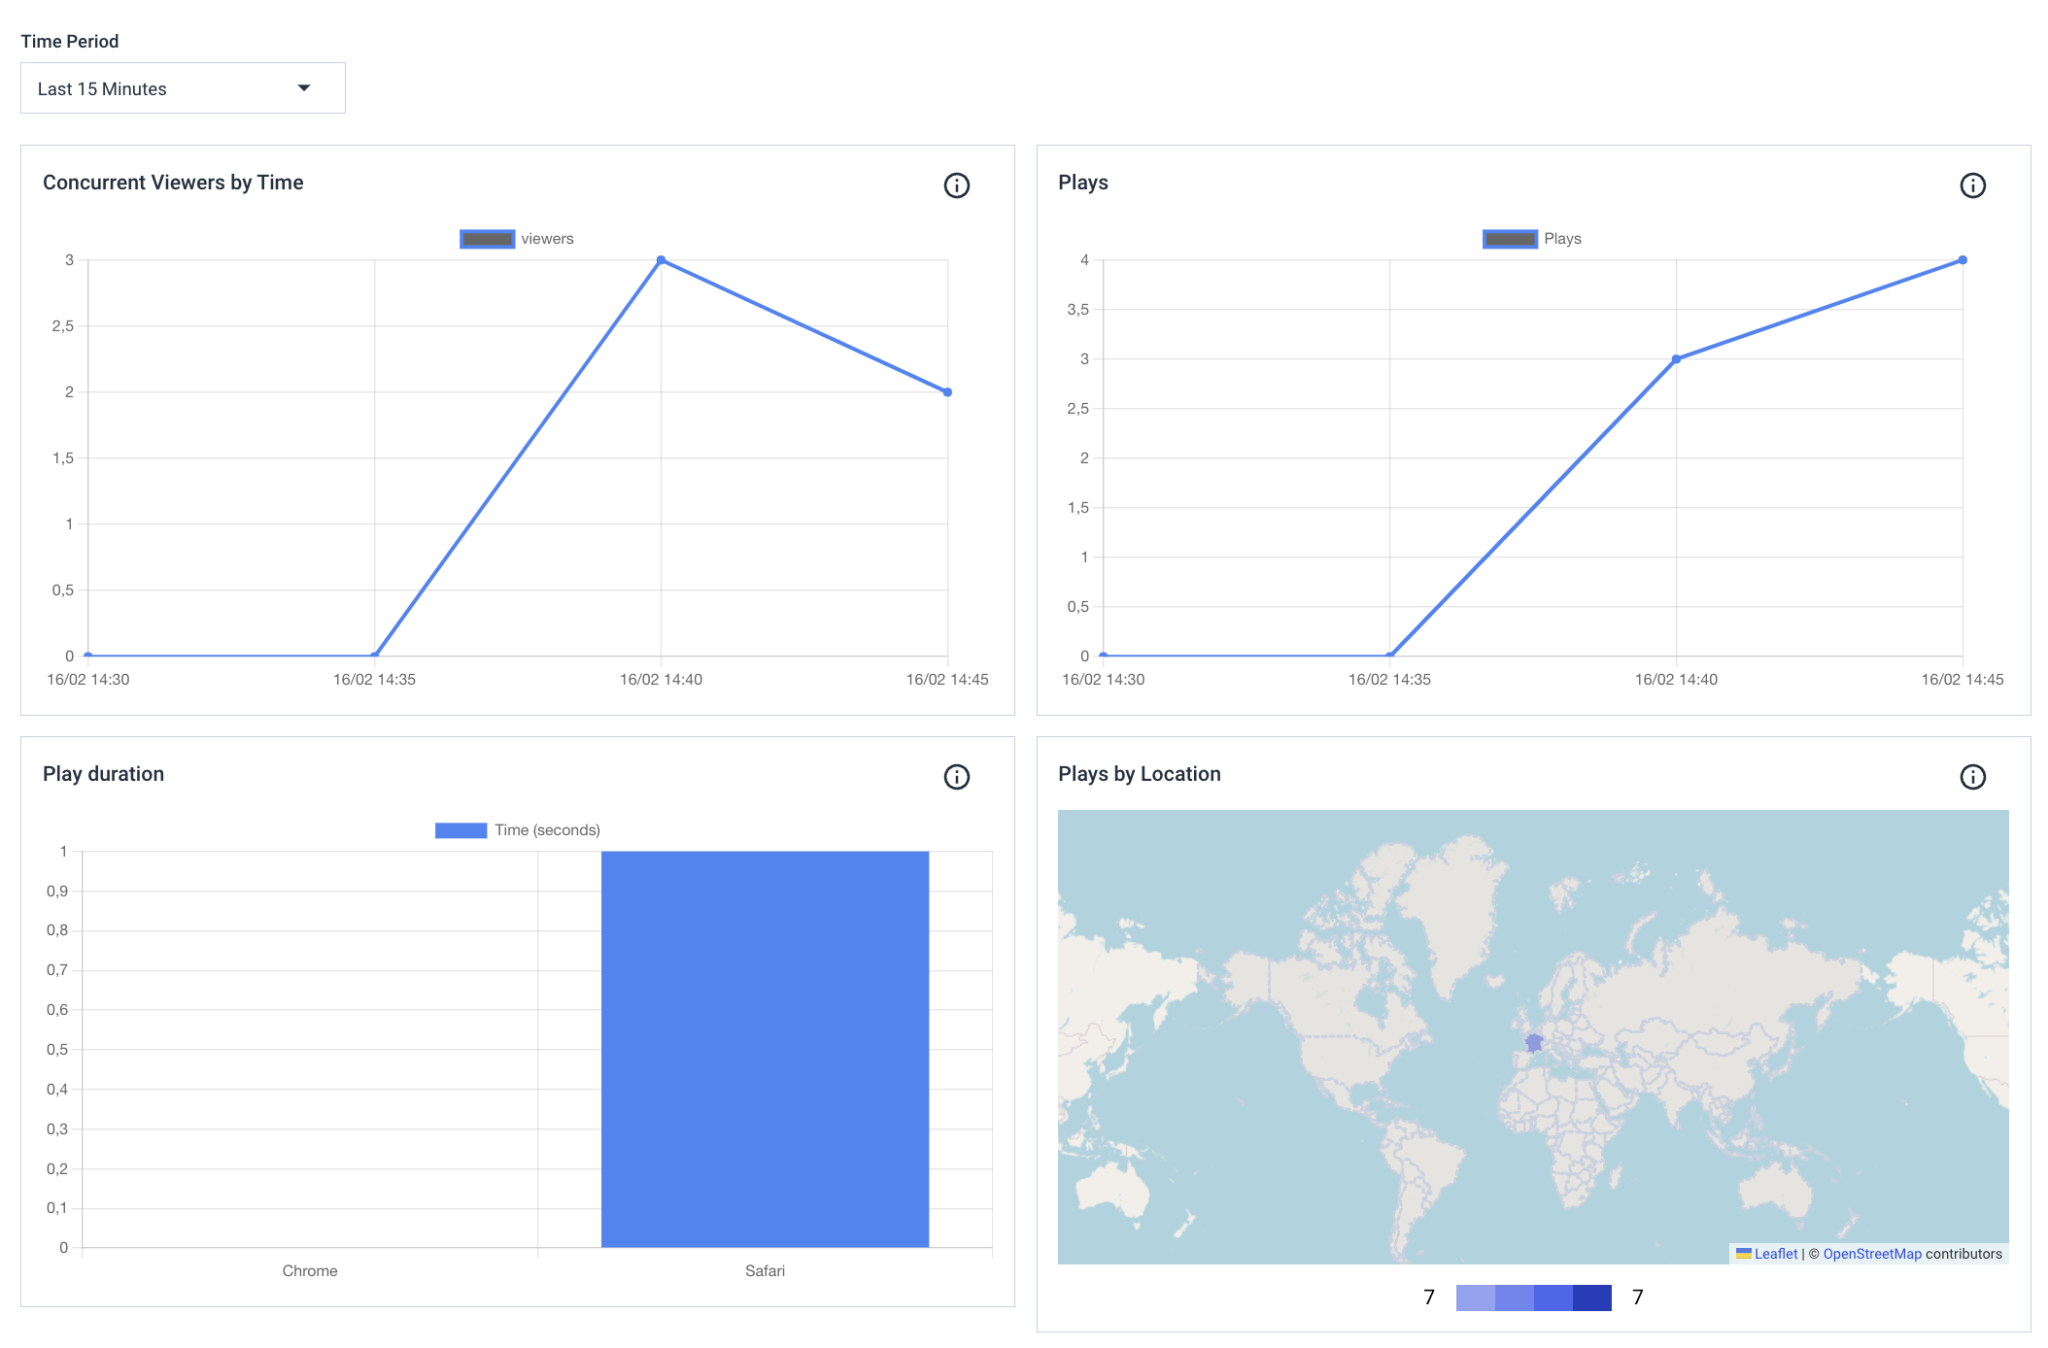
Real-Time Analytics
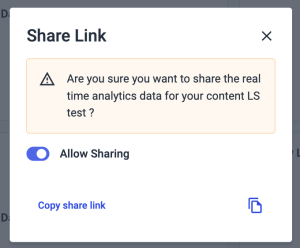
Real-time Analytics gives you real-time stats about your Live Stream. Now you can even share those charts via the Real Time Analytics sharing feature. Just click on Share Link in the upper right corner.
If you have any questions about this feature, please contact us any time,
Not yet a Dacast user, and interested in trying Dacast risk-free for 14 days? Sign up today to get started.
Additional Resources
- Real-Time Video Analytics for Live Streams: A Walkthrough
- Dacast Revenue Analytics: How to Read the Graphs
- How to Link Google Analytics to Your Dacast Account
- How Long Does it Take for the Dacast Analytics Dashboard to Populate?